Sunday, June 9, 2024

schedule performance index (SPI)

 The schedule performance index (SPI) measures how closely your project follows the schedule. In this guide, we share some examples and what to watch out for when working with SPI.

The project schedule is a critical project tool. It communicates many things: which tasks must be done and when, the resources assigned to perform tasks, due dates, the milestones the team has achieved and is yet to achieve, and so on.

A project that’s behind schedule can cause a series of events detrimental to project success:

  • The project goes over budget
  • Deliverables fail quality checks
  • Stakeholders are unhappy
  • Everybody is stressed

This is why project managers, regardless of the project management framework they adopt, use an assortment of techniques and tools - Gantt charts, PERT charts, the prioritization matrix, etc., -- to keep things on schedule.

And then, there’s this indicator called the schedule performance index (SPI), which measures the project’s actual performance against the schedule.

Overview: What is the schedule performance index (SPI)?

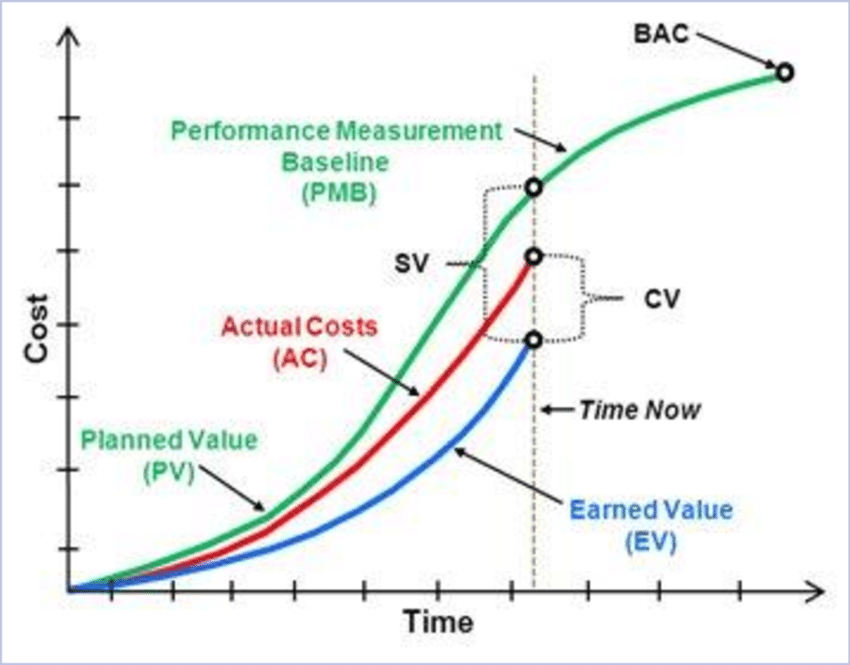
The schedule performance index is a subset of earned value management (EVM), a popular but controversial technique for measuring project performance. EVM shows how the work accomplished to date measures against the baselines established during the project planning stage.

Both schedule variance (SV), also an EVM calculation, and SPI measure whether a project is behind, on, or ahead of schedule. SV gauges how much the actual work is deviating from the planned schedule, while SPI is the ratio of the performed work to the scheduled work.

It quantifies scheduling efficiency and shows, in percentage terms, the project’s status vis-a-vis the timeline.

Find more info on the schedule variance calculation, plus examples, in our SV article here.

Schedule performance index (SPI) vs. cost performance index (CPI): What's the difference?

Cost performance index (CPI) is also an earned value metric. While SPI measures scheduling efficiency, CPI measures the project’s cost efficiency. It’s the ratio of the work completed to date to the total amount spent to complete the work.

The CPI formula is:

  • Cost Performance Index (CPI) = Earned Value (EV) / Actual Cost (AC)
  • CPI = EV / AC

If the CPI calculation is:

  • Equal to 1: The project is on budget.
  • Less than 1: The project is over budget. The value of the performed work is less than the money spent.
  • Greater than 1: The project is under budget. The value of the performed work is greater than the money spent.

To calculate earned value:

  • Earned Value (EV) = % of Completed Work x Budget at Completion (BAC)
  • EV = % Actual Complete x BAC

Budget at completion is the total project budget.

As for the AC, get all the costs associated with the work performed, including labor, machinery, travel, software licenses, etc.

Cost schedule index (CSI)

Another earned value formula worth mentioning is the cost schedule index. It measures the project’s overall efficiency and indicates how likely a project that’s deviating from baselines is to recover.

It’s calculated as:

  • Cost Schedule Index (CSI) = Cost Performance Index (CPI) x Schedule Performance Index (SPI)
  • CSI = CPI x SPI

The farther the CSI is from 1.0, the more unlikely a project that is late and/or over budget is to recover.

What is the formula for the schedule performance index?

To illustrate the relationship between earned value and planned value, which are necessary for calculating SPI, take a look at this graph:

A line graph showing that the earned value is greater than the planned value to date.

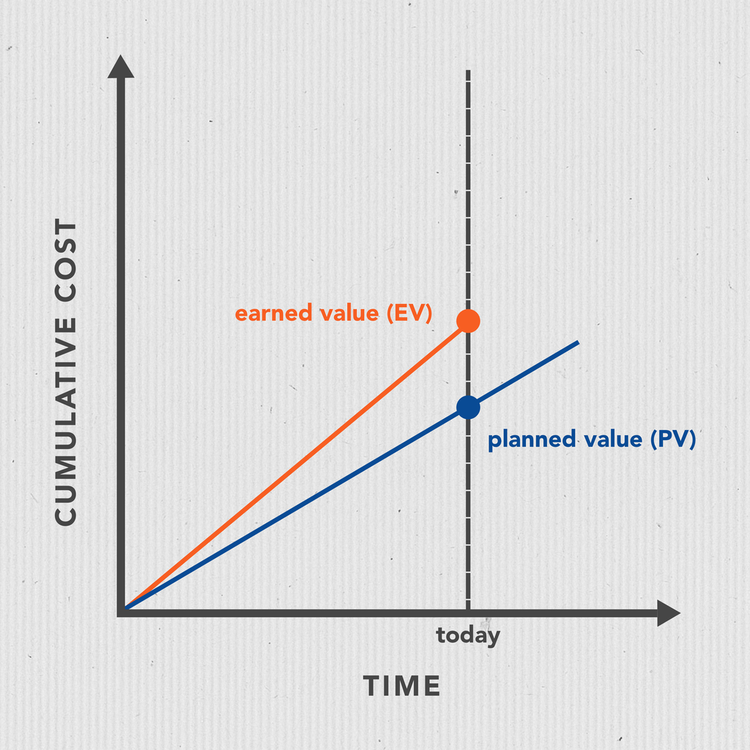
Here, we see that the performed work (earned value) to date is greater than the scheduled work (planned value). Image source: Author

To calculate your project’s SPI performance, the formula is:

  • Schedule Performance Index (SPI) = Earned Value (EV) / Planned Value (PV)
  • SPI = EV / PV

If the SPI calculation yields a value that is:

  • Greater than 1: The project is ahead of schedule.
  • Less than 1: The project is behind schedule.
  • Equal to 1: The project is on schedule.

We already know how to calculate the earned value. To find the planned value, multiply the percentage of the scheduled work to the project’s budget.

  • Planned Value (PV) = Planned % Complete x Budget at Completion (BAC)
  • PV = % Planned Complete x BAC

So if your project is scheduled for, say, two weeks and it’s now exactly a week since you started, according to the schedule, your project should already be 50% complete.

Let’s consider some examples.

Example SPI calculation No. 1

Project #1 has a $5,000 budget and is scheduled for 30 days. To date, 50% of the work is complete, which is in line with the project’s schedule.

Spreadsheet with six columns and three rows showing the project’s budget and schedule.

50% of the work is complete, as scheduled, but the actual cost is $500 more than planned. Image source: Author

Based on the figures on the sheet, the earned value is:

  • EV = % Actual Complete x BAC
  • EV = 50% x $5,000
  • EV = $2,500

The planned value to date is:

  • PV = % Planned Complete x BAC
  • PV = 50% x $5,000
  • PV = $2,500

Substituting EV and PV in the SPI formula, we get:

  • SPI = EV / PV
  • SPI = $2,500 / $2,500
  • SPI = 1.00

Since SPI is equal to 1, the project is on schedule. You’re getting an hour’s worth of work for every hour you put into the project.

Now, if you’re thinking, sure, it’s on schedule, but it’s over budget, you are correct. But SPI isn’t designed to measure cost efficiency. That’s CPI’s job -- hence, the “cost” in cost performance index.

Spreadsheet showing the project’s earned and planned values, plus schedule and cost performance indexes.

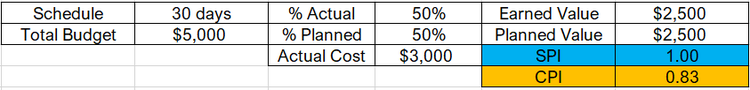
This project is on schedule but over budget, as indicated by the CPI. Image source: Author

To calculate CPI:

  • CPI = EV / AC
  • CPI = $2,500 / $3,000
  • CPI = 0.83

Since CPI is less than 1, the project is over budget. For every $1 you spend on the project, you get $0.83 back.

Example SPI calculation No. 2

Next, we have a 15-day project on a $10,000 budget. Three-fourths of the project is scheduled for completion today, but the project team went above and beyond expectations by completing 80% of the work instead of 75%.

A spreadsheet showing a project’s budget and schedule and how the project is performing.

The project is early. Completed work to date is greater than planned. Image source: Author

The project’s earned value is:

  • EV = % Actual Complete x BAC
  • EV = 80% x $10,000
  • EV = $8,000

As for planned value:

  • PV = % Planned Completed x BAC
  • PV = 75% x $10,000
  • PV = $7,500

Now, computing for SPI, we have:

  • SPI = EV / PV
  • SPI = $8,000 / $7,500
  • SPI = 1.06

Since SPI is greater than 1, our project is ahead of schedule. For every hour you put in, you get back 1.06 hours’ worth of work.

But what about the CPI? To get the CPI:

  • CPI = EV / AC
  • CPI = $8,000 / $8,000
  • CPI = 1.00

In terms of cost efficiency, the project is on budget. You get a dollar’s worth of work for every dollar you spend on it.

A section of a spreadsheet with details on a project’s budget, schedule, and the work completed to date.

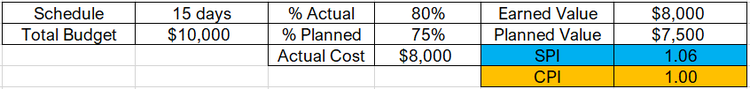
Based on our SPI and CPI calculations, the project is on budget and ahead of schedule.

Earned Value Analysis

Earned Value Analysis Essentials

Get the inside scoop on EVA and its impact on the rail industry. Stay informed with the latest updates and developments.


 EVA or Earned Value Analysis is an industry accepted standard methodology to provide consistent, numerical indicators for the evaluation and comparison of projects.

It focuses on three areas;

  • Measuring project progress
  • Forecasting a projects completed date and final costs
  • Understanding schedule and budget variances as a project progresses

Various calculations and terms are part and parcel of this process, here is a list of the 10 things you really need to know about Earned Value Analysis:

1. What is the purpose of EVA?

According to a detailed study by Fleming and Koppelman, once you’re 20% into a project, your current performance can be used to predict the future of the project with a plus or minus 10% deviation.

Earned value analysis builds on this to compare the planned work with what has actually been completed to determine if cost, schedule and work accomplished are progressing as planned.

2. BCWS - Budgeted Cost of Work Scheduled

Budgeted Cost of Work Scheduled (BCWS), also called the Planned Value (PV), is the sum of the budget for all work scheduled to be accomplished with a given time period. It also includes the cost of previous work completed and can address a specific period of performance or a date in time.

BCWS = % Complete (Planned) x Project Budget

A Contractor usually reports the Budgeted Cost or Work Performed (BCWP) on all work packages completed for a project. The BCWP is then compared to BCWS to determine if the project is behind or ahead of where it’s projected to be.  If the contractor has not completed all the scheduled work packages on time, then the BCWP will be less than the BCWS.

Worked Example

PV = Total project cost * % of planned work

Example 10 month project is £100,000.

PV for the completed project = £100,000

PV at 2 months =  £100,000 * 20% = $20,000

PV can also be calculated for a period of time, month 3-6 inclusive =  £100,000 * 40% = £40,000.

3. ACWP - Actual Cost of Work Performed

The Project Management Institute defined Actual Cost of Work Performed as “the realised cost incurred for the work performed during a specific time period”.

The ACWP is reported by the contractor’s accounting system in accordance with generally accepted accounting procedures and is simply stated actuals are actuals.

ACWP can be considered both cumulatively or for a given period of time. The difference between the BCWP and the ACWP is the Cost Variance (CV).

Worked Example

Assume ACWP or AC = £70,000

4. BCWP - Budgeted Cost of Work Performed

The budgeted Cost of Work Performed (BCWP) is the budgeted cost of the value of work that has actually been completed to date.

Otherwise known as the Earned Value (EV).

Contractors usually report the BCWP on individual packages within a project and compare it to Budgeted Cost of Work Scheduled (BCWS) to understand if a project or package is being or ahead of where it was projected to be .

If the contractor has not completed all the scheduled work packages on time, then the BCWP will be less than the BCWS.

Worked Example

BWCP or EV = Total Project cost * % of actual work complete =  £100,000 * 55% = £55,000.

5. SV - Schedule Variance (BCWP-BCWS)

Schedule Variance (SV) indicates how much ahead or behind schedule the project is. It measures whether a project is on track by calculating actual progress against expected progress

Schedule Variance can be calculated using the following formula:

  • Schedule Variance (SV) = Earned Value (EV) – Planned Value (PV)
  • Schedule Variance (SV) = BCWP – BCWS

This variance indicates how much cost of the work is yet to be completed as per schedule or how much cost of work has been completed over and above the scheduled cost.

  • Positive Schedule Variance: Indicates we are ahead of schedule
  • Negative Schedule Variance: Indicates we are behind schedule

Worked Example

SV = BCWP - BCWS

SV =   £55,000 - £60,000

SV = -£5000

SV% = SV / BCWS

SV% = -£5000 / 60,000

SV% = -8%

This indicates that the project is 8% behind schedule.

6. CV - Cost Variance (BCWP-ACWP)

Cost Variance (CV) indicates how much over or under budget the project is.

It is used to track expense line items, but can also be tracked at the project level, as long as there is a budget allocated to the item.  CV is used by the Project Manager and Quantity Surveyor to determine how best to use the renaming resources.

Cost Variance can be calculated using the following formulas:

Cost Variance (CV) = Earned Value (EV) – Actual Cost (AC)

Cost Variance (CV) = BCWP – ACWP

Cost Variance % indicates how much over or under budget the project in terms of a percentage;.

Positive = indicates how much under budget the project

Negative = indicates how much over budget the project

Worked Example

CV = EV – AC

CV at 6 months = £55,000 – £70,000 = -£15,000

CV% = (CV/EV) *100 = (-£15000/£55,000) *100 = -27%

This implies that we are 27% over budget.

7. SPI - Schedule Performance Index  

SPI reviews the project performance from a schedule perspective and can be calculated using the following formula:

  • SPI = Earned Value (EV) / Planned Value (PV)
  • SPI = BCWP / BCWS

SPI value greater than (≥) 1: indicates the project team is very efficient in utilising the time allocated to the project

SPI value less than (≤) 1: indicates the project team is less efficient in utilising the time allocated to the project

Worked Example

SPI = BCWP / BCWS

SPI = £55,000 / £60000

SPI = 0.92

This indicates that the project is only 92% as per the original plan or is 8% behind schedule.

8. CPI - Cost Performance Index  

Cost Performance Indicator can be calculated as using the following formulas:

CPI = Earned Value (EV) /Actual Cost (AC)

CPI = BCWP / ACWP

CPI is an index showing the efficiency of the utilisation of the resources on the project.

Greater than (≥) 1 indicates efficiency in utilising the resources allocated to the project is good.

Less than (≤) 1: indicates efficiency in utilising the resources allocated to the project is not good.

Worked Example

CPI = BCWP / ACWP

CPI = £55,000 / £70,000

CPI = 0.79

0.79 indicating the project expenditures are at 79% of the plan.

9. CSI - Cost Schedule Index  

If a project is slipping on programme or likely to over spend then the Cost Schedule Index is a valuable measurement to consider.  It measures the project’s overall efficiency and indicates how likely a project that’s deviating from baselines is to recover.

It’s calculated as:

Cost Schedule Index (CSI) = Cost Performance Index (CPI) x Schedule Performance Index (SPI)

The farther the CSI is from 1.0, the more unlikely a project that is late and/or over budget is to recover.

Worked Example

CSI = CPI * SPI

CSI = 0.79 * 0.92

CSI = 0.72

10. EAC - Estimate at Completion

Estimate at completion is the forecasted cost of the project, as the project progresses. There are a number of different ways to determine the EAC.

The most common way to determine EAC is a “bottom-up” approach where the actual costs (AC) are added to the forecasted remaining – the estimate to complete (ETC).

EAC = Actual costs (AC) + estimate to complete (ETC)

Alternatively, if the project has recurring variances then the following formula is recommended:

EAC = Budget at Completion (BAC) ÷ Cost Performance Index (CPI)

Raildiary seeks to address the challenges of detailed alignment of value and cost collection through automation of site diary date with data visulisation tools such as Microsoft Power BI.

Project Selection – Net Present Value (NPV)


Definition

Net Present Value (NPV) of the sum of all cash inflows (in Present Value) of the project minus the initial cost, i.e.  PV (benefits) – PV (costs) (Read more)

NPV is an effective tool to help determining whether a project will be profitable,

  • NPV > 0 – the project is profitable
  • NPV = 0 – the project will break even
  • NPV < 0 – the project will lose money

Sample Question

For the software project, $100,000 would be needed which is expected to generate a total of $200,000 (in present value) over 5 years. What is the Net Present Value (NPV) of the project?

A. $100,000
B. $200,000
C. $300,000
D. -$100,000

Solution: A

Since the Net Present Value (NPV) is the present value of all benefits minus all costs, i.e. NPV = $200,000 – $100,000 = $100,000.

Higher the better

The larger the Net Present Value (NPV), the more profitable the project is to the organization.

All PMP Cost Management Formulas (Earned Value Management – CPI, SPI, CV, SV, EAC, ETC, TCPI, VAC)

https://www.pmclounge.com/all-pmp-cost-management-formulas/

Schedule Performance Index

SPI = EV/PV
EV = Earned Value
PV = Planned Value

< 1 behind schedule
= 1 on schedule
> 1 ahead of schedule

Cost Performance Index

CPI = EV/AC
EV = Earned Value
AC = Actual Cost

< 1 Over budget
= 1 On budget
> 1 Under budget

Schedule Variance

SV = EV-PV
EV = Earned Value
PV = Planned Value

< 0 Behind schedule
= 0 On schedule
> 0 Ahead of schedule

Cost Variance

CV = EV-AC
EV = Earned Value
AC = Actual Cost

< 0 Over budget
= 0 On budget
> 0 Within budget

Estimate At Completion, if original is flawed

EAC = AC+ETC
AC = Actual Cost
ETC = Estimate to Completion

if the original estimate is based on wrong data/assumptions or circumstances have changed ETC mentioned here is a ‘new ETC’

Estimate At Completion, if BAC remains the same

EAC = AC+BAC-EV
AC = Actual Cost
BAC = Budget at completion
EV = Earned Value

the variance is caused by a onetime event and is not likely to happen again

Estimate At Completion, if CPI remains the same

EAC = BAC/CPI
BAC = Budget at completion
CPI = Cost performance index

if the CPI would remain the same till end of project, i.e. the original estimation is not accurate

Estimate At Completion, if substandard performance continues

EAC = AC+(BAC-EV)/(CPI*SPI)
AC = Actual Cost
BAC = Budget at completion
EV = Earned Value
CPI = Cost Performance Index
SPI = Schedule Performance Index

use when the question gives all the values (AC, BAC, EV, CPI and SPI), otherwise, this formula is not likely to be used

To Complete Performance Index (TCPI)

TCPI = (BAC-EV)/ (BAC-AC)
BAC = Budget at completion
EV = Earned value
AC = Actual Cost

TCPI is basically – Remaining Work / Remaining Funds

< 1 Under budget
= 1 On budget
< 1 Over budget

If EAC is available use EAC-AC instead of BAC-AC

Estimate To Complete (ETC)

ETC = EAC-AC
EAC = Estimate at Completion
AC = Actual Cost

Variance At Completion (VAC)

VAC = BAC-EAC
BAC = Budget at completion
EAC = Estimate at Completion

Inference

For variances like SV, CV and VAC – negative is bad, positive is good

For indices like CPI and SPI – less than 1 is bad, more than 1 is good. However, the opposite is true for TCPI

Diagrammatic Representation

diagrammatic representation - All PMP Cost Management Formulas (Earned Value Management - CPI, SPI, CV, SV, EAC, ETC, TCPI, VAC)

schedule performance index (SPI)

  The schedule performance index (SPI) measures how closely your project follows the schedule. In this guide, we share some examples and wha...