Earned Value Analysis Essentials
EVA or Earned Value Analysis is an industry accepted standard methodology to provide consistent, numerical indicators for the evaluation and comparison of projects.
It focuses on three areas;
Various calculations and terms are part and parcel of this process, here is a list of the 10 things you really need to know about Earned Value Analysis:
1. What is the purpose of EVA?
According to a detailed study by Fleming and Koppelman, once you’re 20% into a project, your current performance can be used to predict the future of the project with a plus or minus 10% deviation.
Earned value analysis builds on this to compare the planned work with what has actually been completed to determine if cost, schedule and work accomplished are progressing as planned.
2. BCWS - Budgeted Cost of Work Scheduled
Budgeted Cost of Work Scheduled (BCWS), also called the Planned Value (PV), is the sum of the budget for all work scheduled to be accomplished with a given time period. It also includes the cost of previous work completed and can address a specific period of performance or a date in time.
BCWS = % Complete (Planned) x Project Budget
A Contractor usually reports the Budgeted Cost or Work Performed (BCWP) on all work packages completed for a project. The BCWP is then compared to BCWS to determine if the project is behind or ahead of where it’s projected to be. If the contractor has not completed all the scheduled work packages on time, then the BCWP will be less than the BCWS.
Worked Example
PV = Total project cost * % of planned work
Example 10 month project is £100,000.
PV for the completed project = £100,000
PV at 2 months = £100,000 * 20% = $20,000
PV can also be calculated for a period of time, month 3-6 inclusive = £100,000 * 40% = £40,000.
3. ACWP - Actual Cost of Work Performed
The Project Management Institute defined Actual Cost of Work Performed as “the realised cost incurred for the work performed during a specific time period”.
The ACWP is reported by the contractor’s accounting system in accordance with generally accepted accounting procedures and is simply stated actuals are actuals.
ACWP can be considered both cumulatively or for a given period of time. The difference between the BCWP and the ACWP is the Cost Variance (CV).
Worked Example
Assume ACWP or AC = £70,000
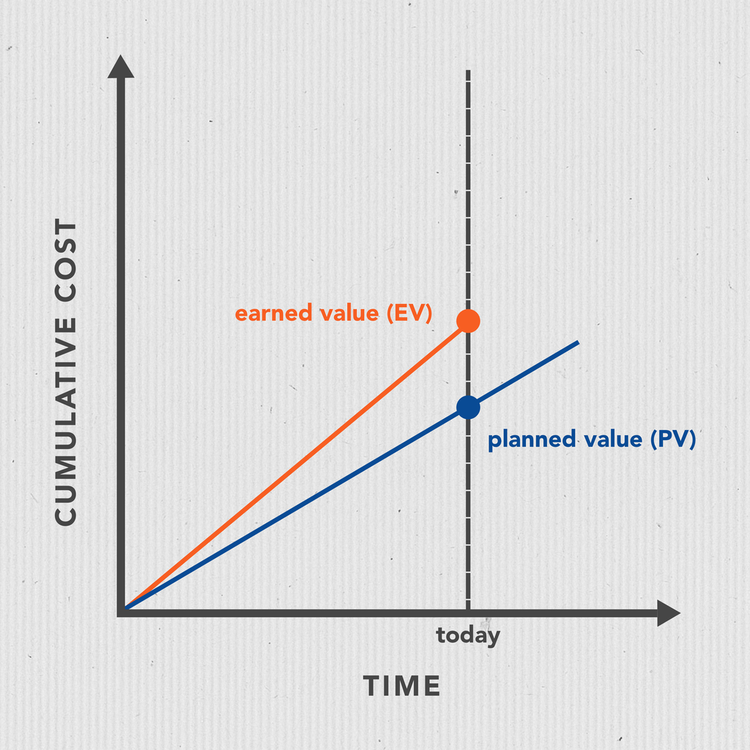
4. BCWP - Budgeted Cost of Work Performed
The budgeted Cost of Work Performed (BCWP) is the budgeted cost of the value of work that has actually been completed to date.
Otherwise known as the Earned Value (EV).
Contractors usually report the BCWP on individual packages within a project and compare it to Budgeted Cost of Work Scheduled (BCWS) to understand if a project or package is being or ahead of where it was projected to be .
If the contractor has not completed all the scheduled work packages on time, then the BCWP will be less than the BCWS.
Worked Example
BWCP or EV = Total Project cost * % of actual work complete = £100,000 * 55% = £55,000.
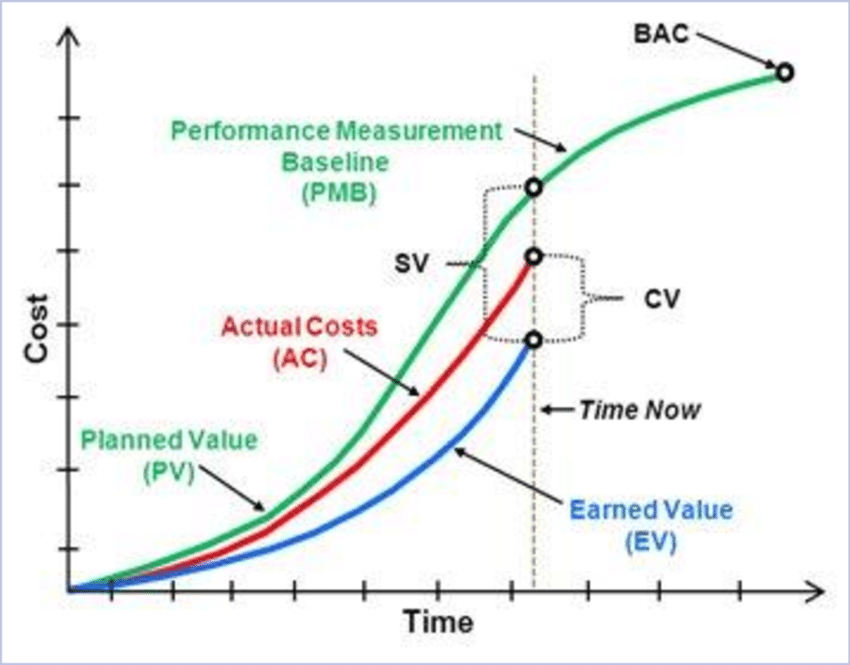
5. SV - Schedule Variance (BCWP-BCWS)
Schedule Variance (SV) indicates how much ahead or behind schedule the project is. It measures whether a project is on track by calculating actual progress against expected progress
Schedule Variance can be calculated using the following formula:
This variance indicates how much cost of the work is yet to be completed as per schedule or how much cost of work has been completed over and above the scheduled cost.
Worked Example
SV = BCWP - BCWS
SV = £55,000 - £60,000
SV = -£5000
SV% = SV / BCWS
SV% = -£5000 / 60,000
SV% = -8%
This indicates that the project is 8% behind schedule.
6. CV - Cost Variance (BCWP-ACWP)
Cost Variance (CV) indicates how much over or under budget the project is.
It is used to track expense line items, but can also be tracked at the project level, as long as there is a budget allocated to the item. CV is used by the Project Manager and Quantity Surveyor to determine how best to use the renaming resources.
Cost Variance can be calculated using the following formulas:
Cost Variance (CV) = Earned Value (EV) – Actual Cost (AC)
Cost Variance (CV) = BCWP – ACWP
Cost Variance % indicates how much over or under budget the project in terms of a percentage;.
Positive = indicates how much under budget the project
Negative = indicates how much over budget the project
Worked Example
CV = EV – AC
CV at 6 months = £55,000 – £70,000 = -£15,000
CV% = (CV/EV) *100 = (-£15000/£55,000) *100 = -27%
This implies that we are 27% over budget.
7. SPI - Schedule Performance Index
SPI reviews the project performance from a schedule perspective and can be calculated using the following formula:
SPI value greater than (≥) 1: indicates the project team is very efficient in utilising the time allocated to the project
SPI value less than (≤) 1: indicates the project team is less efficient in utilising the time allocated to the project
Worked Example
SPI = BCWP / BCWS
SPI = £55,000 / £60000
SPI = 0.92
This indicates that the project is only 92% as per the original plan or is 8% behind schedule.
8. CPI - Cost Performance Index
Cost Performance Indicator can be calculated as using the following formulas:
CPI = Earned Value (EV) /Actual Cost (AC)
CPI = BCWP / ACWP
CPI is an index showing the efficiency of the utilisation of the resources on the project.
Greater than (≥) 1 indicates efficiency in utilising the resources allocated to the project is good.
Less than (≤) 1: indicates efficiency in utilising the resources allocated to the project is not good.
Worked Example
CPI = BCWP / ACWP
CPI = £55,000 / £70,000
CPI = 0.79
0.79 indicating the project expenditures are at 79% of the plan.
9. CSI - Cost Schedule Index
If a project is slipping on programme or likely to over spend then the Cost Schedule Index is a valuable measurement to consider. It measures the project’s overall efficiency and indicates how likely a project that’s deviating from baselines is to recover.
It’s calculated as:
Cost Schedule Index (CSI) = Cost Performance Index (CPI) x Schedule Performance Index (SPI)
The farther the CSI is from 1.0, the more unlikely a project that is late and/or over budget is to recover.
Worked Example
CSI = CPI * SPI
CSI = 0.79 * 0.92
CSI = 0.72
10. EAC - Estimate at Completion
Estimate at completion is the forecasted cost of the project, as the project progresses. There are a number of different ways to determine the EAC.
The most common way to determine EAC is a “bottom-up” approach where the actual costs (AC) are added to the forecasted remaining – the estimate to complete (ETC).
EAC = Actual costs (AC) + estimate to complete (ETC)
Alternatively, if the project has recurring variances then the following formula is recommended:
EAC = Budget at Completion (BAC) ÷ Cost Performance Index (CPI)
Raildiary seeks to address the challenges of detailed alignment of value and cost collection through automation of site diary date with data visulisation tools such as Microsoft Power BI.


No comments:
Post a Comment